
"The Telegraph" Real-Time Dashboard
A filterable dashboard visualizing real-time data to the Telegraph news website. By utilizing back-end technology developed by the Webtrends engineering team, I was able to extract multiple types of data showing real-time fluctuations in demographics, devices, channels, geolocation, and trending articles. Individual news articles, categories, or authors can be selected to show only data associated with that data point.
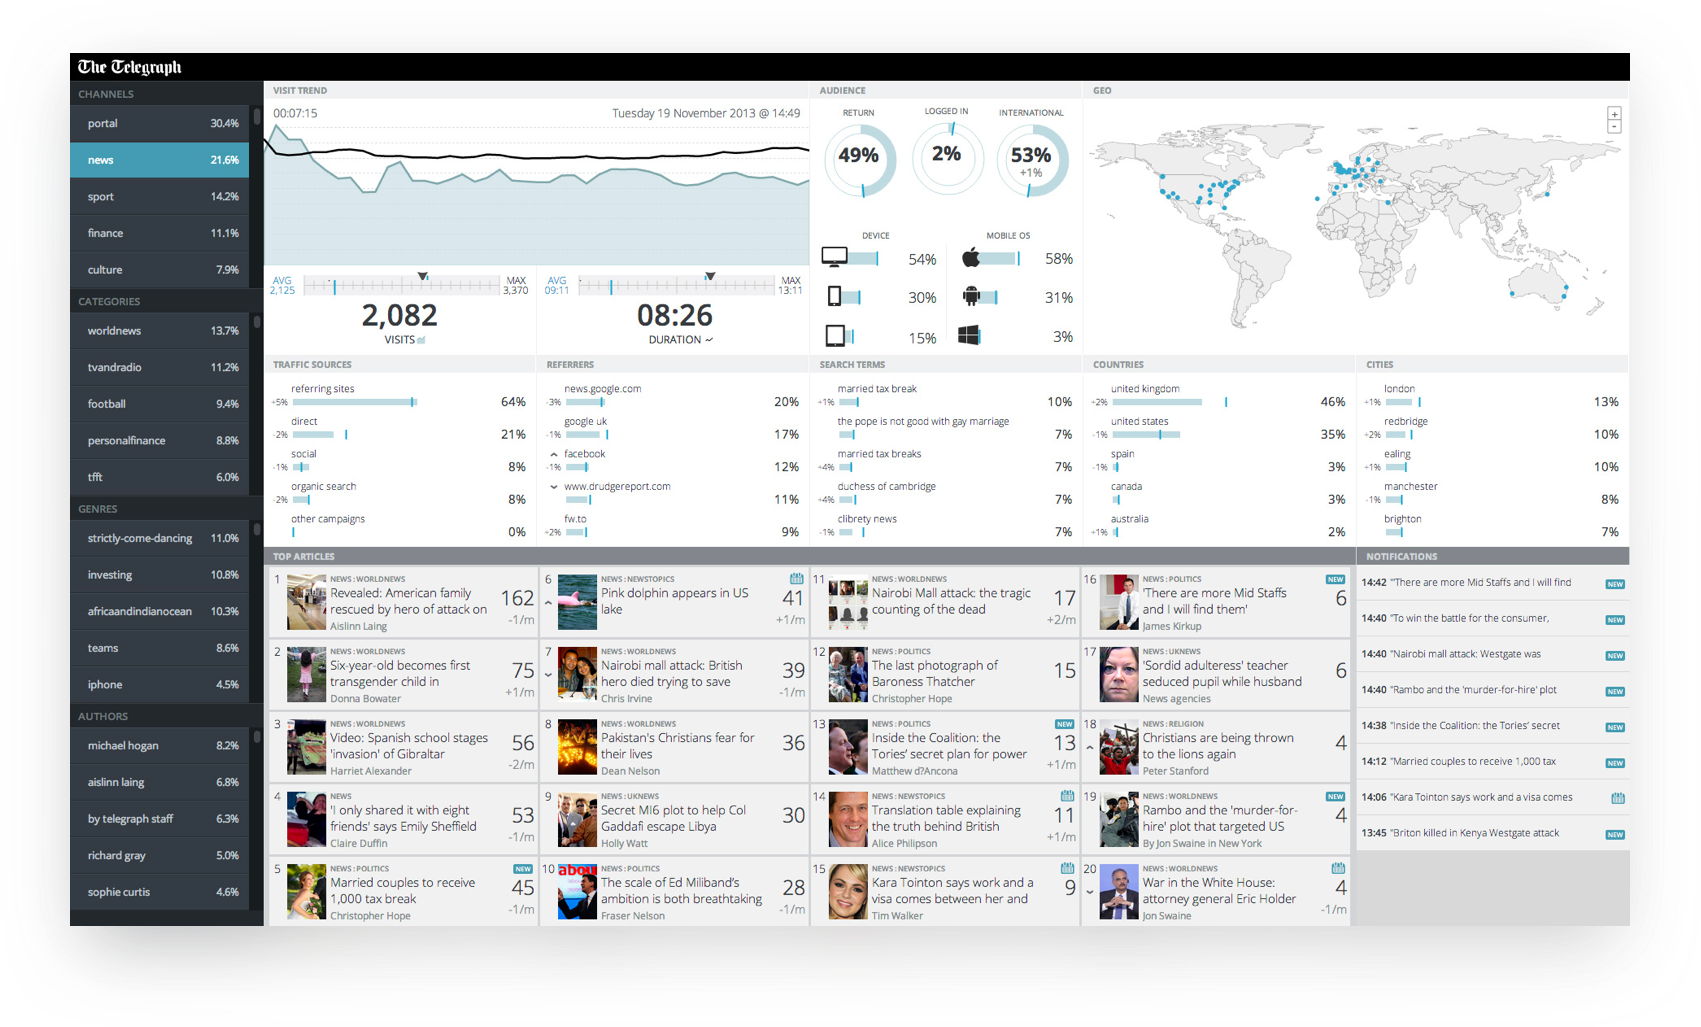
"THE TELEGRAPH" STREAMING DATA VISUALIZATION
This was a proof-of-concept to validate the power of Webtrends back-end streaming data technology. I worked with a front-end developer to build the UI and animations.
REEBOK SOCIAL ACTIVITY OVERVIEW
Reebok came to us with the concept of building a social media command center to monitor customer engagement across all their social media channels. This visualization acted as proof-of-concept for a larger scale future project. We were able to extract 3 months of historical data and visualize the engagement trends over that period.